NanoBiz Korea
나노비즈코리아

A typical hyperspectral map registered by an Attolight CL tool corresponds of 256 pixel x 256 pixel. At every pixel, intensities of over thousand colours are registered. This yields to a typical hyperspectral cube with over 56 million data points.
제품설명
Features
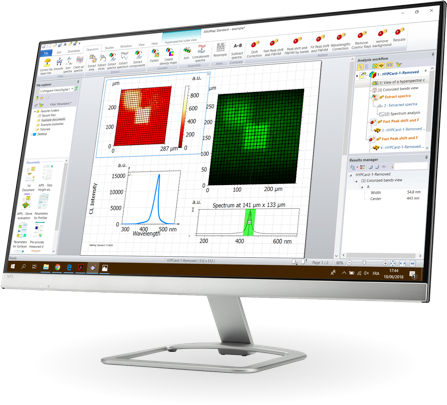
- Interactive visualisation of SEM images, series of spectra and hyperspectral maps
- Automated spectral peak detection with creation of FWHM maps and peak wavelength maps
- Spectra and series of spectra extraction from a hypercube
- Export function for data into open data format and proprietary data format
- system parameters in ASCII format
- image export: jpg and png
- hyperspectral data: ASCII and SURF (Attomap proprietary format)
- Individual dongle to network distributed multi-user license
- Colocalization: Co-localize 3D maps and secondary electron (SE) images
Automation
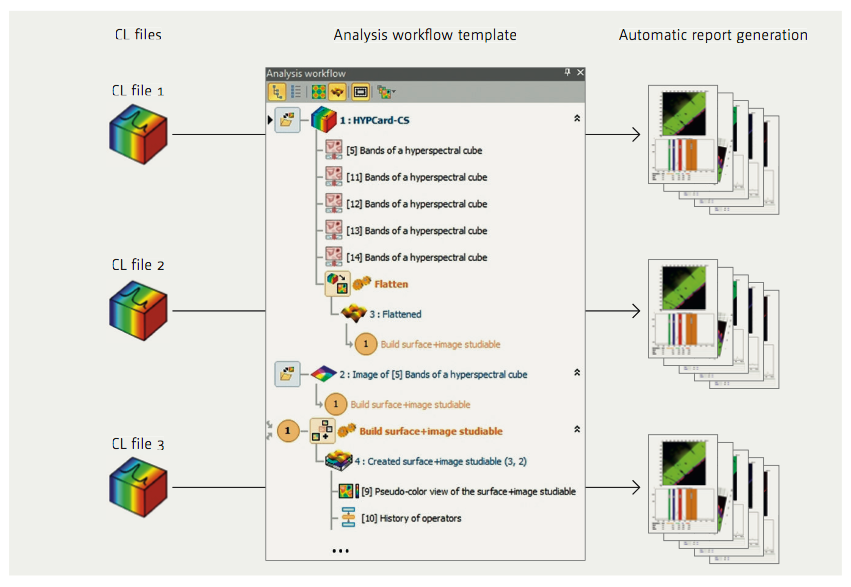
Work fast in a smart user environment in your own language and analyze series of hyperspectral maps automatically.
 Select one of ten languages and create your analysis report frame
by frame, page by page, in a highly intuitive and interactive smart desktop publishing environment. Powerful automation tools ensure high productivity: series of hyperspectral maps can be analyzed automatically and common sequences of analysis steps can
be saved for insertion in any future analysis document.
Report generation: interactivity and traceability
Turn your cathodoluminescence data into accurate, visual data analysis reports.
Each analysis step can be ne-tuned at any time and is recorded in a hierarchical work ow that guarantees full metrological traceability.
Visualization: 2D RGB & 3D maps
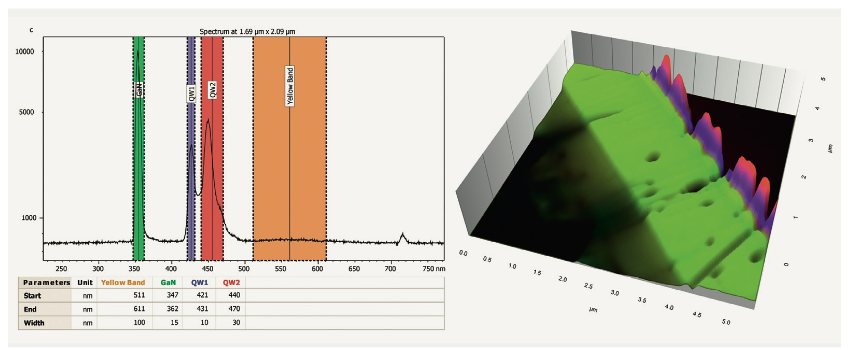
Associate spectroscopic features with colors and add the 3rd dimension to show emission intensity variations.
Color bands are associated with relevant spectroscopic features.
The 3D image makes it possible to immediately recognize emission intensity variations between features.
Attomap builds on the industry leading MountainsMap® software solution from our partner Digital Surf


